Vermont directory of affordable rental housing
User guide
The Vermont Community Profiles are displayed using Tableau, a software that creates interactive data visualizations. These visualizations or "vizzes" are controlled by filters, allowing users to select only the information that interests them.
Expand one of the topics of interest below to learn how to interact with visualizations, use filters, and download data:
Page Controls
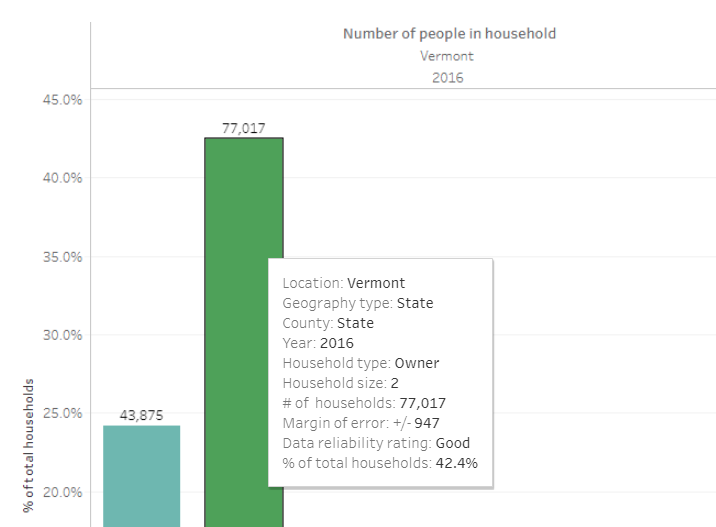
Tooltip
- Hover over the chart or graph to learn more information related to that data point.
Filters
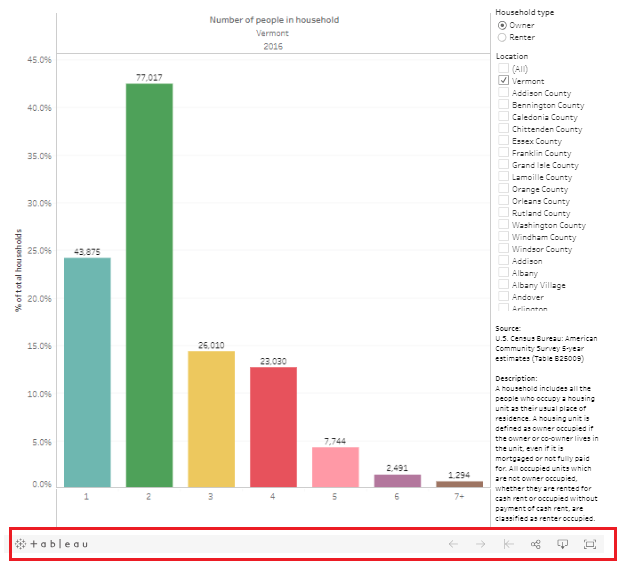
- Use the filters provided to select the data you want to view.
- Filters on the right side of the visualization control all graphs and tables displayed on the visualization.
- Filters on the left side of the visualization control only the graph or table they are located next to.
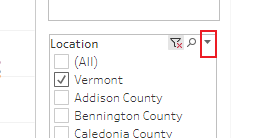
- Filters include the following selection items:
- Select all: Checks off all of the options in the filter. Click a second time to unselect all options in the filter.
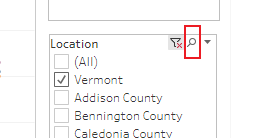
- Search: Type in a specific value available in the filter.

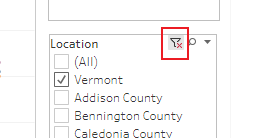
- Include/Exclude: Tableau's default is to include the values selected in the filter. By clicking on the button, the user has the option to exclude the selected filter items.
Sort
- Hover over an axis or header on a graph or chart to reveal the sort button.
- Click on the sort button to reorder the data in the graph or chart.
- Note: Tableau can only display data by category. Therefore, if results are sectioned into year or geography, it can only sort data within that year or category.
Toolbar
Toolbar
The toolbar on the bottom of each data visualization contains the following controls:
- Undo/Redo: Reverses or reapplies last action on visualization.
- Each successive click adjusts the view further back or forward:
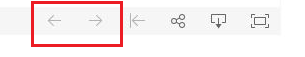
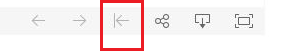
- Undo All: Returns the view to default settings:
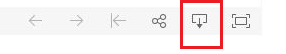
- Download: Captures the view for use in other applications:
- See section on Downloading Data for further instructions.
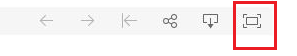
- Full Screen: Expands the view to full screen size:
Downloading Data
Downloading data
- Data can be downloaded for other uses using the Download button on the Tableau toolbar at the bottom of the page:
- The following screen will appear:
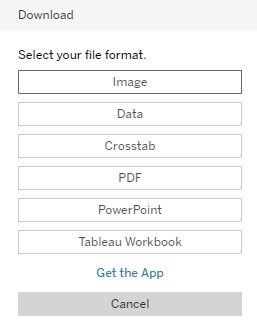
- Tableau allows the following download options:
- Image: Downloads the selected view as a photo or displays the image in a new browser tab (depending on browser settings).
- Data: Displays the data from the view in a new browser window in a table with two tabs:
- Summary: contains aggregated data for the fields shown in the view.
- Underlying: contains underlying data for the selected fields in the display.
- Crosstab: Saves the underlying data for the selected fields in the visualization to a CSV (comma-separated values) file which can then be opened in Microsoft Excel.
- PDF: Downloads the selected view as a PDF or displays the PDF in a new browser tab (depending on browser settings).
- Powerpoint: Downloads a Powerpoint file containing the selected view as an image
- NOTE: Sometimes when data is downloaded as a crosstab, Tableau will organize data from a graph or table in a different way than users might expect. Unfortunately, this is a feature of software resulting from the method we had to use to input data to the software. The best workaround to get more usable downloads is to choose the "Data" option in the download menu, which will open the view in a new browser window in a table with two tabs. Select the "Full data" tab. Then click the hyperlink that says "Download all rows as a text file". This will open a csv (comma separated value) file, which can be saved to your computer as an Excel workbook.
- Download troubleshooting:
- The data and crosstab options may be grayed out (i.e. not clickable) on the download menu. To activate these options, you may need to interact with the view. The easiest way to do this is to double click on any data point within the table or graph.
- Tableau will only download data from the options selected in the filters. If you wish to download the entire data set, you must select "all" in every field.
- This may overload the visualization, displaying a gray screen, since the visualization does not have room to display the chosen data. However, you can still download the selected data in a table or crosstab, even if the visualization itself cannot display all those fields.
- If there are multiple graphs and tables on the view, Tableau will only download data/crosstabs from the last table or graph clicked on. You cannot download from multiple visualizations at one time.
- A few of the visualizations have summary tables at the bottom of the page to facilitate convenient download.
- If the file does not download or the new window does not open, you may need to disable your browser's pop-up blocker.
- Tableau does not allow users to copy text within a visualization on a screen. The best workaround is to download the viz as a PDF and then copy and paste text from there.
Frequently Asked Questions
- Why is the visualization I am looking at grayed out?
- You have selected too many locations for Tableau to display in one graph or chart. Either click the reset button, or uncheck “All” in the filter and then re-select fewer options. However, if you wish to download data for all locations using the Data or Crosstab options, you can still select all locations and click download, even though the view itself is grayed out.
- I received an error message. What should I do?
- Try exiting the web page, then going back in again. If the visualization does not reset after multiple attempts, please contact us.
- How can I copy the description from the visualization? The visualization won't let me highlight the text.
- Tableau does not allow users to copy text within a visualization on a screen. The best workaround is to download the viz as a PDF and then copy and paste the text from that document.
- When I download data from a table as a crosstab, the spreadsheet is formatted strangely. How do I fix this?
- Unfortunately, this is a feature of software resulting from the method we had to use to input data to the software. The best workaround to get more usable spreadsheets is to choose the "Data" option in the download menu, from which you can download a csv file. For more detailed instructions, see the Downloading Data section above.
©
Vermont Housing Finance Agency
164 Saint Paul Street
P.O. Box 408
Burlington, VT 05402-0408 USA
164 Saint Paul Street
P.O. Box 408
Burlington, VT 05402-0408 USA
